
Table of contents
- How Many Crashes Occurred in Florida in 2025?
- What Types of Crashes Are Most Common in Florida?
- How Many People Died from Car Accidents in Florida in 2025?
- Where Crashes Happen Most in Florida in 2025: by Counties
- Florida 7-Year Crash Trends 2017–2025: What Changed, What Didn’t, and Why It Matters
- Why So Many Crashes Happen in Florida
- Practical Ways to Reduce Your Risk on Florida Roads
- The Bottom Line and What Comes Next
We’ve all heard it. Florida has a reputation for dangerous drivers and unpredictable roads. For many people here, that doesn’t feel like a stereotype. It feels like everyday driving.
Still, headlines and rankings only tell part of the story. To understand the real risk, we dug into years of Florida crash data, looking at overall crashes, crash types, fatalities, and how those numbers relate to each other over time. We asked simple but important questions. How often do crashes actually happen? Who is most at risk? And how many lives are lost each day and each year?
Those numbers matter because they represent real people, not statistics. They help explain why even careful drivers can end up in serious accidents and why Florida’s roads can feel dangerous on an ordinary day.
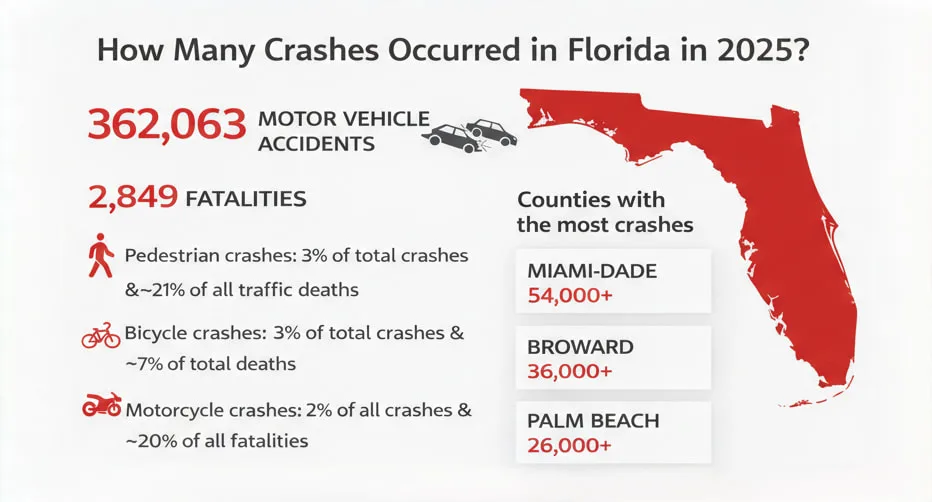
How Many Crashes Occurred in Florida in 2025?
As of January 2026, final FLHSMV data reports 362,063 motor vehicle accidents in Florida in 2025, covering all crash types statewide. That number reflects car accidents, motorcycle crashes, pedestrian and bicycle incidents, and hit-and-run collisions.
Put simply, Florida saw about 992 car accidents per day in 2025, on average. In practical terms, crashes were happening every few minutes, across highways, city streets, and parking lots.
More than 235,964 of those crashes involved injuries in just one year.
What stands out most is how routine these incidents have become. And while many people assume serious accidents only happen at high speeds or on major highways, the data shows injuries and fatalities occurring in all kinds of settings, often during ordinary trips people take every day.
What Types of Crashes Are Most Common in Florida?
When we break down accidents in Florida in 2025 by type, a few patterns stand out. Here’s how the most common crash types stack up as a share of Florida’s total crashes:
- Pedestrian crashes: 10,577 crashes, or about 2.9% of total crashes
- Bicycle crashes: 9,801 crashes, making up roughly 2.7% of all crashes
- Motorcycle crashes: 8,800 crashes, or about 2.4% of all crashes
- Hit-and-run crashes: 91,164 incidents, accounting for about 25.2% of all crashes
Some crashes happen far more often than people expect, while others, though less common, carry a much higher risk of serious injury or death.
How Many People Died from Car Accidents in Florida in 2025?
As of the final FLHSMV 2025 data, 2,849 people lost their lives in traffic crashes across Florida. When we break that down, it means about 7 to 8 people are killed on Florida roads every single day.
Those 2,849 fatalities came from 2,662 fatal crashes, which matters. The number of deaths is higher than the number of fatal crashes because many collisions claimed more than one life.
When we look closer at the fatal accidents data, we also see clear patterns in who is most at risk:
- Pedestrian crashes: 600 fatalities, or about 21.1% of all traffic deaths, despite representing roughly 2.9% of total crashes.
Pedestrians face one of the highest risks on Florida roads. Even though these crashes are less common by volume, they are far more likely to result in fatal outcomes. - Motorcycle crashes: 559 fatalities, making up nearly 19.6% of all fatalities, while accounting for only about 2.4% of total crashes
Riders have little physical protection, and even lower-speed impacts can be deadly. - Bicycle crashes: 195 fatalities, or about 6.8% of total deaths, from just under 2.7% of crashes.
Cyclists continue to face rising exposure on Florida roads, and their fatality share remains disproportionately high compared to how often these crashes occur. - Other car and truck crashes: 1,495 fatalities, accounting for about 52.5% of all deaths, while making up the vast majority of total crashes.
While vehicle-to-vehicle crashes are far more common, they are less likely to be fatal on a per-crash basis compared to crashes involving pedestrians, cyclists, or motorcyclists.
This gap helps explain why Florida’s roads feel especially dangerous for pedestrians, cyclists, and motorcyclists.
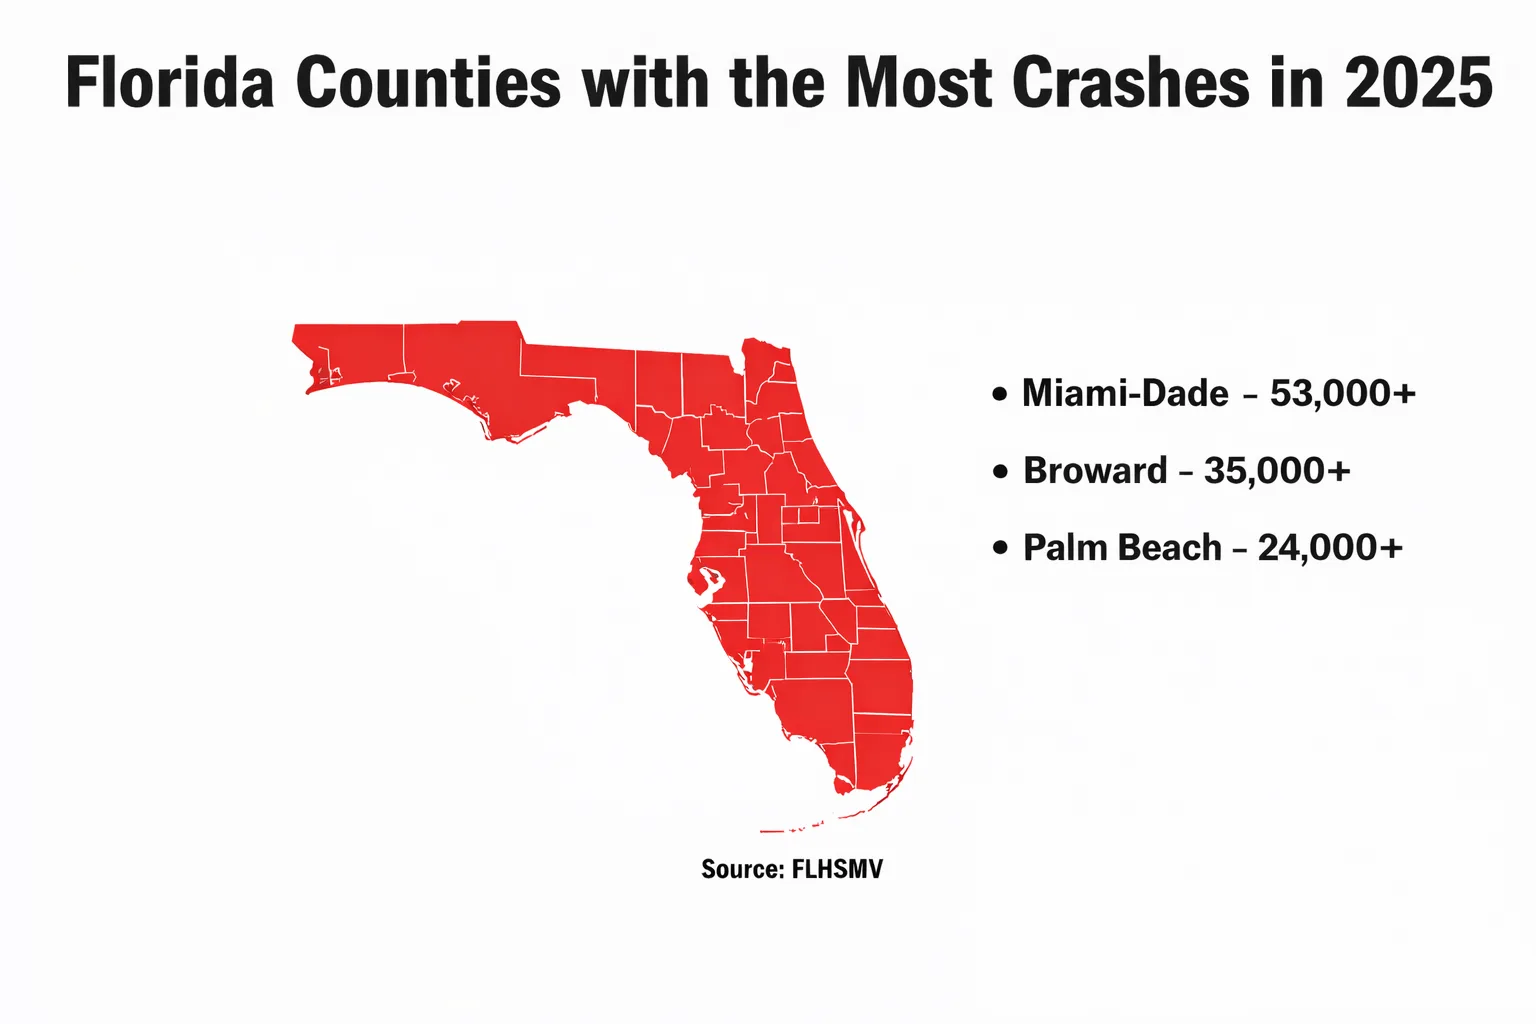
Where Crashes Happen Most in Florida in 2025: by Counties
Looking at preliminary 2025 data, the counties with the highest crash totals are Florida’s most populated, most traveled, and most congested areas. These are places where daily commuting, tourism, and heavy road use overlap.
Florida Counties with the Most Crashes in 2025
| County | Total Crashes | Total Fatalities | Total Injuries |
|---|---|---|---|
| Miami-Dade | 54,788 | 261+ | 26,052+ |
| Broward | 36,629+ | 206 | 22,256 |
| Palm Beach | 25,286+ | 154 | 15,973+ |
| Hillsborough | 24,822 | 169 | 15,684 |
| Orange | 25,106 | 164 | 18,860 |
| Lee | 13,426 | 106 | 8,688 |
- South Florida continues to lead in total crashes.
Miami-Dade and Broward stand well above the rest of the state. Dense population, constant traffic, tourism, and complex road systems all contribute. - Central Florida shows high crash volume with a different risk profile.
Orange, Hillsborough, and Palm Beach counties cluster closely together. These areas combine heavy commuting with tourism, theme parks, and major highways. - Smaller counties still see serious consequences.
Lee County recorded fewer crashes overall, but still reported over a hundred fatalities and thousands of injuries. Even outside major metro areas, the risk of serious harm remains real.
Florida 7-Year Crash Trends 2017–2025: What Changed, What Didn’t, and Why It Matters
Looking at Florida’s crash data over multiple years, the trends reveal how risk has shifted, where conditions worsened, and why some dangers refuse to go away, even as others improve.
From 2017 to 2019, Florida’s crash totals were remarkably consistent, hovering around 402,000 crashes per year. Then 2020 disrupted everything. Traffic dropped sharply during the pandemic, total crashes fell, yet fatalities rose. The years that followed exposed an even deeper problem. 2021 became the deadliest year in this dataset, and while crashes and fatalities have declined since then, the improvement has been gradual, not dramatic.
The table below shows how overall crash volume and fatalities changed year by year.
| Year | Total Crashes | Crashes per Day | Total Fatalities | Fatalities per Day |
|---|---|---|---|---|
| 2017 | 402,694 | 1,103.3 | 3,115 | 8.53 |
| 2018 | 403,626 | 1,105.8 | 3,135 | 8.59 |
| 2019 | 401,867 | 1,101.0 | 3,185 | 8.73 |
| 2020 | 341,399 | 932.8 | 3,332 | 9.10 |
| 2021 | 401,540 | 1,100.1 | 3,741 | 10.25 |
| 2022 | 397,620 | 1,089.4 | 3,553 | 9.73 |
| 2023 | 395,175 | 1,082.7 | 3,375 | 9.25 |
| 2024 | 381,417 | 1,042.1 | 3,102 | 8.48 |
| 2025* | 352,879 | 982.9 | 2,728 | 7.60 |
What stands out immediately is that fewer crashes did not always mean fewer deaths. That disconnect becomes even clearer when we look at specific crash types over time.
Crash Types: What Stayed Stubbornly Dangerous Over The Years
While overall crash numbers rose and fell, certain types of crashes remained consistently dangerous:
| Year | Pedestrian Crashes | Pedestrian Fatalities | Motorcycle Crashes | Motorcycle Fatalities | Bicycle Crashes | Bicycle Fatalities |
|---|---|---|---|---|---|---|
| 2017 | 9,437 | 662 | 9,713 | 549 | 6,680 | 127 |
| 2018 | 9,356 | 720 | 9,143 | 531 | 6,590 | 160 |
| 2019 | 9,736 | 734 | 8,895 | 550 | 6,664 | 156 |
| 2020 | 8,117 | 715 | 8,045 | 552 | 5,952 | 169 |
| 2021 | 9,569 | 835 | 8,649 | 621 | 6,404 | 197 |
| 2022 | 10,247 | 786 | 9,270 | 631 | 7,301 | 220 |
| 2023 | 10,306 | 791 | 9,548 | 621 | 8,418 | 234 |
| 2024 | 10,499 | 678 | 9,455 | 599 | 9,325 | 209 |
| 2025* | 10,203 | 574 | 8,517 | 540 | 9,571 | 190 |
Even when total fatalities declined in recent years, exposure for vulnerable road users stayed high. Pedestrians, motorcyclists, and cyclists continued to face disproportionate risk year after year.
Why the Ups and Downs Happened and What It Means for Florida Drivers
- 2020 wasn’t safer. It was emptier.
Total crashes dropped in 2020 because fewer people were driving. But the drivers who stayed on the road often drove faster. Speed turns survivable crashes into fatal ones, especially on Florida roads. - 2021 was the rebound year, and the deadliest year.
Traffic returned, but risky habits didn’t disappear. More cars, higher speeds, and distractions combined to push fatal crashes to their highest point in this period. It wasn’t just more driving. Crashes were more likely to end in death. - 2022–2025 shows gradual improvement, not a victory lap.
After 2021, crash totals and fatalities slowly trended downward. That improvement matters, but perspective matters too. Even in “better” years, Florida still lost multiple people every day on its roads. The danger didn’t disappear. It eased off the peak. - Vulnerable road users stayed in the danger zone almost every year.
Pedestrian crashes climbed steadily over time and remained high through 2025. While pedestrian deaths declined slightly in the last two years, the number of people struck did not meaningfully drop, keeping injury risk high.
Motorcyclists and cyclists followed a similar pattern.
Motorcycle fatalities stayed elevated from 2021 through 2024, and even with some improvement in 2025, they came alongside thousands of motorcycle crashes statewide. For riders, there is very little margin for error.
Bicycle crashes rose sharply after 2021 and remained high through 2024 and 2025. Fatality totals shifted year to year, but increased exposure meant more people at risk, even when deaths temporarily eased. - Hit-and-run trends track behavior, not just traffic volume.
When hit-and-run crashes rise, it often points to deeper issues: impaired driving, uninsured motorists, suspended licenses, panic, and split-second decisions to flee. These crashes leave injured people without immediate help and create some of the most stressful situations we see.
Why So Many Crashes Happen in Florida
When we look at Florida’s crash data over time, the causes stay largely the same. Most serious accidents aren’t random. They stem from a handful of repeat behaviors that show up year after year.
- Speeding is one of the biggest factors. Florida’s wide roads and high-speed arterials make it easy to drive faster than conditions allow. Higher speeds leave less time to react and lead to far more severe injuries when crashes occur.
- Distracted driving continues to play a major role. Phones, navigation systems, and in-car screens pull attention away at critical moments. Even a quick glance can mean missing a pedestrian, stopped traffic, or a changing light.
- Impaired driving remains a persistent risk. Alcohol and drugs are still involved in many fatal crashes. Florida’s nightlife, tourism, and year-round social scene increase exposure, especially on weekends and at night.
- Intersection errors are common and dangerous. Many serious crashes happen when drivers rush through lights, misjudge turns, or fail to yield. These mistakes often lead to side-impact and pedestrian crashes with severe outcomes.
- Uninsured and hit-and-run drivers add another layer of risk. Florida has a high number of uninsured motorists. When crashes happen, fear of consequences leads some drivers to flee, leaving injured people without immediate help or clear answers.
Practical Ways to Reduce Your Risk on Florida Roads
No one can control every driver around them. But there are steps that genuinely reduce risk, especially given Florida’s specific driving conditions.
- Slow down on arterial roads and near intersections. Many of Florida’s deadliest crashes happen on familiar roads, not highways.
- Assume distraction from others. Expect delayed reactions at lights and sudden lane changes.
- Be especially alert around pedestrians and cyclists. Urban areas, beach towns, and tourist zones carry a higher risk. In high-crash counties like Miami-Dade, Broward, Palm Beach, Hillsborough, and Orange, expect heavier congestion, more sudden lane changes, and drivers unfamiliar with local roads.
- Avoid aggressive driving during low-traffic hours. Empty roads often lead to higher speeds and worse crashes.
- Carry adequate insurance coverage. Uninsured and underinsured motorist coverage matters more in Florida than many drivers realize.
- After any crash, call 911. Even if it seems minor, documentation protects you later.
These steps won’t eliminate risk, but they can lower the chances that a routine drive turns into something far more serious.
The Bottom Line and What Comes Next
Florida’s crash data tells a clear story. While there have been some improvements in recent years, serious accidents remain a daily reality. Speeding, distraction, impairment, and the ongoing risks faced by pedestrians, cyclists, and motorcyclists continue to shape who gets hurt and how badly. Many crashes happen in seconds, often because of someone else’s mistake.
But statistics don’t capture what happens after the crash. If you or someone you love has been injured in a Florida car accident, you may be dealing with pain, medical appointments, missed work, and pressure from insurance companies all at once.
We help people across Florida navigate this moment every day. With offices throughout the state, from West Palm Beach, Miami, Fort Lauderdale, Tampa, Port St. Lucie, to Fort Myers, and beyond, we know Florida roads, Florida insurance practices, and the communities we serve. Our role is to step in, protect your rights, and handle the legal side so you can focus on recovery. You don’t need to have everything figured out before reaching out. A free consultation is often enough to understand your options and what makes sense for your situation.